US (1) 832 225 2106
Health Check
Health Check Diagnostic offers a thorough analysis of ESPs through advanced petroleum engineering calculations. This feature is crucial for identifying and predicting potential issues while proactively uncovering opportunities to increase oil production, ultimately ensuring optimal equipment efficiency and extending run life.
Operational Condition and Health Status
1
2
3
4
5

At the top of the Dashboard, you will find the well header information, with the most relevant data defining the well and the type of ESP pump that is currently installed. Key parameters to mention are:
-
Total Number of ESP wells.
-
ESP Manufacturer
-
ESP Type
-
Sum of all pump stages including tapered pumps
-
Run Life: Time elapsed since the pump was installed.
6
7
8
9
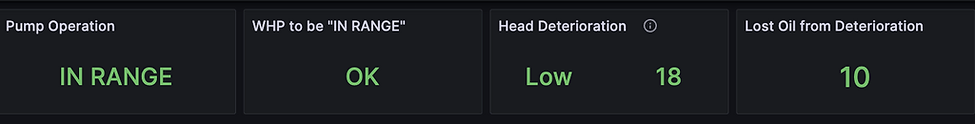
6.Pump Operation: Within the pump performance curve obtained from the well health check, defined as follows:
-In Range: The pump is operating within its maximum and minimum limits, ensuring efficiency and reliability.
-Upthrust: Indicates the pump is operating above the maximum allowed limit, causing mechanical stress and potential damage.
-Downthrust: Indicates the pump is operating below its minimum operational limit, leading to increased pressure.
7.WHP (Wellhead Pressure): This is the necessary pressure to bring the pump back into range. Status: "OK" indicates no action is required; otherwise, the required pressure in psi will be displayed.
8.Head Deterioration: Indicates the loss of pump lifting capacity due to deterioration, categorized as low, medium, or high, with the percentage of deterioration provided. This value could be related to gas ingested by the pump, mechanical issues, or other factors.
Please note that this value may differ from those displayed in other dashboard headers (e.g., Real-Time Trends), as the Health Check value is based on the current well test, whereas the "Real-Time Trends" value reflects a 10-day average.
9. Lost Oil (BOPD): Oil lost due to pump deterioration, relative to the pump and reservoir capacity.
Operational Status
Analysis: Provides a brief summary of the operational status.
1
2
3
4
5

1.Frequency: The speed at which the pump is operating, measured in Hertz (Hz).
2.Productivity Index: The well's production capacity, defined as barrels of fluid produced per day per psi.
3.Drawdown: The pressure drop relative to the reservoir pressure, calculated as (Reservoir Pressure - Bottom Hole Flowing Pressure [BHFP]) ÷ Reservoir Pressure, expressed as a percentage.
4.BHFP (Bottom Hole Flowing Pressure): The bottom hole pressure as calculated by the numerical model.
5.Pump Efficiency: The efficiency of the pump, determined by factors such as the required power, flow rate, and head.
6
7
8
9
10

6.Required Motor HP: The horsepower required for lifting fluids
7.Fluid Speed: The necessary fluid speed for cooling the motor, with a minimum of one foot per second.
-
Motor Cooling:
- < 1 ft/s fluid speed too low to maintain proper motor cooling.
- > 11 ft/s fluid speed too high to maintain motor cooling .
-
Housing erosion:
- Stainless Steel: 17ft/s
- Aluminum 6ft/s Coper 8 ft/s
8.Gas Lock Risk: Risk level indicated as low, medium, or high. This represents the likelihood of the pump operating under unstable conditions or becoming locked due to gas action. The risk is calculated by considering the Gas Volume Fraction (GVF) and the Turpin factor trends, which help evaluate potential gas control measures like PID.
9.GVF @ Intake: The Gas Volume Fraction (GVF) at intake, representing the ratio of the gas volumetric flow rate to the total volumetric flow rate at the intake.
Model Run Status
This table outlines the requirements for the model to operate effectively. All components must be marked as "OK," and the most recent test should have been conducted within the last two days.
If no well test is available for a period exceeding two days, Enerview will display the last valid well test for the model. If a well test is recorded on the current date, red-colored indicators will highlight the reasons why the model cannot be executed.
Model will run

Model will not run

Historical Test
This section allows for the evaluation of well and pump performance over time. By clicking on the desired test, the system will display the operational status of the equipment at that specific moment.

Model Perfomance Charts
Pump Head vs. Flow Curve
Key characteristics:
-
Pump head performance curves (purple curves)
-
Operation envelope (tornado curve) (grey curves)
-
Operating point (green dot). Note: For taper completions, Enerview shows the system's operating point and the main pump's operating point (green dot). The system's operating point is the sum of the head generated by each type of pump installed.
-
The sensitivity points (blue dots)
The graph is modified by the % of deterioration, displaying the real pump flow rate and head capacity,
tapered

Single

1
2
4
Pressure Gradient
This graph evaluates the well's pressure gradient, calculated by the numerical model. It divides the system into three parts as defined below, and representing the well's performance without accounting for pump deterioration.
-
a.Wellhead to Pump Discharge (purple dotted line)
b. Well head pressure measured (orange dot)
c. Pump discharge pressure calculated (purple dot)
-
a.Pump Discharge to Pump Intake (blue-yellow line)
b. Pump intake pressure measured (blue dot)
c. Pump intake pressure without head deterioration (blue dot)
-
a.Pump Intake to Reservoir Perforations (purple-yellow line)
b. Bottom hole pressure calculated (purple dot)
c. Bottom hole pressure without head deterioration (yellow dot)
It is important to note that the purple line represents the delta pressure from PDP to PIP is the delta pressure for the current pump operating condition. In contrast, the yellow line indicates the "System Head Deterioration,' which reflects the fluid head loss due to pump deterioration.
.png)
1A
1B
1C
2A
2B
3A
3B
3C
Break Horsepower (BHP)
This graph shows the pump's energy requirement in BHP to lift the required fluid. It also displays the motor's nameplate HP (Horizontal dotted yellow line) to prevent exceeding its capacity and causing motor overload.
.png)
Inflow Performance Relationship(IPR)
The IPR curve graphically represents the production rate on the horizontal axis and the flowing bottom-hole pressure on the vertical axis. The curve illustrates how the production rate varies at different bottom-hole pressures.
This graph displays the well's productive performance (purple line), the current operating point (green dot), the outflow curve (yellow line), and the respective oil (green line) and water (blue line) performance curves.
A key feature of this chart is the ability to quickly visualize the potential fluid production gain based on model frequency sensitivities, represented by the blue dots. The yellow dot on the purple IPR curve indicates the total fluid production that could have been achieved if the pump had experienced system head deterioration.
.png)
Fixed Frequency Curve
This graph represents the equipment's operating point on the head curve (blue), BHP curve (red), and efficiency curve (green) at the current operating frequency.
The dotted lines, matching the color of each curve, illustrate the impact of head deterioration on the pump's performance.
.png)
Turpin Correlation
The Turpin correlation links pump performance to in situ gas and liquid volumes, as well as Pump Intake Pressure (PIP), to help determine whether the pump is stable or may experience severe gas interference. Stable pump operation is expected when F < 1.0, while severe gas interference and performance deterioration occur when F > 1.0.
This graph illustrates this correlation, where the gas void fraction (the percentage of free gas in the total fluid) is plotted against PIP. The curve separating stable and unstable operation represents F = 1.0. As shown, the amount of free gas an ESP can handle increases with higher suction pressures (PIP).
The graph also shows two operating points—before and after separation—represented by blue and red dots, respectively. For the red dot, a default separation efficiency of 90% is used. However, if discharge pressure data is available, this value can be calculated more accurately, leading to a more precise determination of the operating point.
.png)
Frequency Sensitivities Summary
The Frequency Sensitive Summary table displays the results of various frequency sensitivity analyses while honoring system constraints, such as nameplate HP and minimum PIP. When the system reaches a constraint frequency, Enerview will automatically flag this with a yellow color under the "Limit" column in the table below. This table helps users understand the relationship between pump frequency (Hz) and fluid rate.

Head Deterioration Level
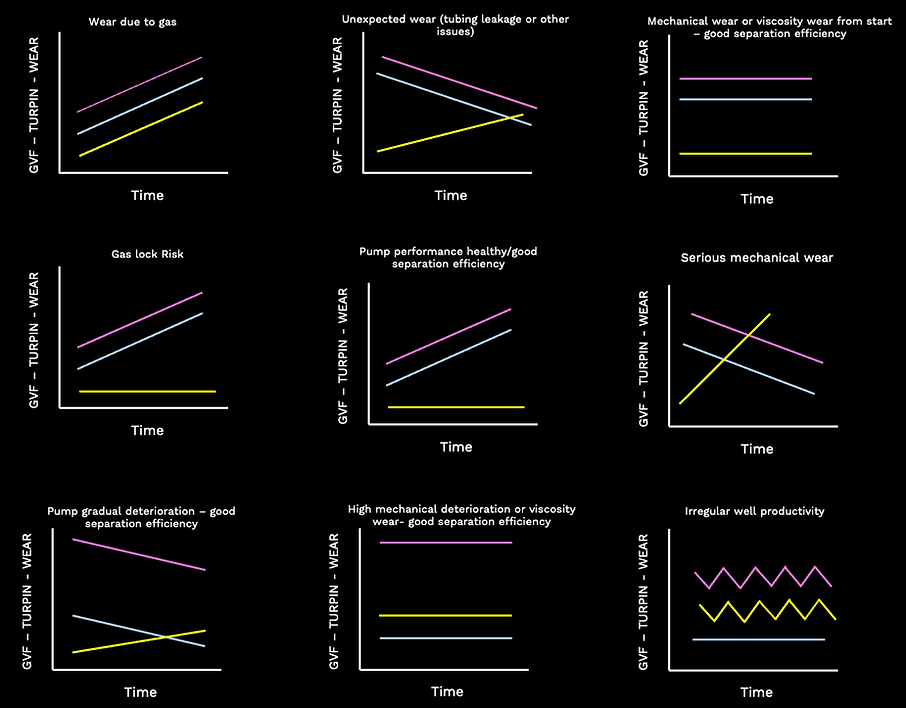
This graph tracks equipment deterioration over time (yellow line) and compares it with the GVF (Gas Volume Fraction - purple line) and the Turpin factor (blue line) to identify potential causes for head deterioration. GVF measures the amount of gas in the fluid being pumped, while the Turpin factor reflects the likelihood of a gas lock occurring.
By examining these variables alongside the pump's deterioration, users can determine the main factors affecting pump health and take corrective actions. For example, if both the GVF and Turpin factor show an upward trend along with head deterioration, it suggests that the presence of gas is causing the degradation.
Conversely, if the GVF and Turpin factor remain stable but head deterioration increases, it indicates that the issue may be mechanical.
It is important to note that when evaluating these trends, the focus should not be on individual data spikes. Instead, users should analyze the historical tendencies of the ESP's behavior over time.

Below is a brief "cheat sheet" outlining the potential trends of these three variables for each possible issue:
BHFP (Bottom hole flowing pressure)
This graph monitors the Bottom Hole Flowing Pressure (BHFP) calculated over time. It provides insights into how the pressure at the bottom of the well changes under various operating conditions and throughout the life of the well. Monitoring BHFP trends is crucial for diagnosing reservoir performance and optimizing production strategies. Consistent tracking of BHFP can reveal issues such as formation damage, reservoir depletion, or changes in fluid composition.

Productivity Index (PI)
This graph monitors the Productivity Index (PI) of the well calculated over time. The PI is a measure of the well's efficiency in producing hydrocarbons, calculated as the production rate divided by the pressure drawdown. A high PI indicates that the well produces a large amount of fluid with a relatively small pressure drop. Monitoring the PI over time helps assess the well's performance and make informed decisions about any necessary interventions or adjustments.


© 2024 by Enerview