US (1) 832 225 2106
Field View
The Field View section offers a global perspective of the production field’s status, consolidating information from the individual health checks of each well. It’s a critical tool for strategic management and field-wide optimization.
-
Overall Field Status: Unified view that shows the general performance of the field, facilitating the identification of trends and areas for improvement.
-
Top Performing Wells with Optimization Opportunities: Highlights wells that are performing efficiently and those with significant potential for improvement.
-
Benchmarking: Comparison of performance across different wells, helping identify successful practices and areas needing attention.
-
Field Production: Detailed data on total production, broken down by field, providing a clear view of each area’s contribution.
-
Monthly Volumes: Monthly tracking of production volumes, allowing for short and long-term trend analysis.
-
Equipment Distribution by Manufacturer: Information on the different manufacturers of the equipment used in the field, aiding in supplier management and performance evaluation.
-
Health Check KPIs: Key indicators that summarize the operational health of the field, supporting informed decision-
ESP Field Production Overview
Provides an overview of the production from fields with ESP (Electric Submersible Pumps), displaying key indicators such as total volume produced, the number of wells in operation, and those experiencing issues or offline.

Deferred Oil Production
Represents the volume of oil production that has not been achieved due to system interruptions, operational issues, or maintenance, detailing the reasons behind these deficiencies. This value is based on the real-time data considering the period when the ESP is down.

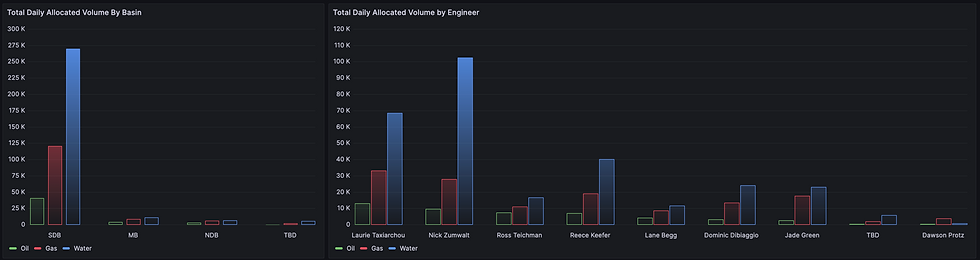
Total Daily Allocateds
Shows the daily allocation of produced volume to each well, highlighting individual contributions and the percentage of total field production, enabling better resource management.
Monthly Oil Exit Volumes
Reflects the total volume of oil exiting the field each month, focusing on monthly trends to assess long-term production performance and analyze potential fluctuations.

ESP KPI'S
Key performance indicators for submersible pumps, including parameters such as efficiency, power consumption, failure rates, and mean time between failures (MTBF), used to assess operational effectiveness and equipment performance.

Production Optimization Opportunities
Identifies opportunities to increase production through improved well efficiency, adjustments in operational parameters, or implementing artificial lift optimization strategies.

Production gain values are an estimate, assuming water cut will not change significantly
Production gain values are calculated based on current well performance and conditions, assuming the water cut remains stable. These estimates provide a projected increase in oil output following optimization, offering insight into the well’s potential without major changes in water production.

Health Check KPIs
Indicators that monitor the condition and health status of wells and equipment, such as pressures, temperatures, and vibrations, to identify potential issues before they impact production and ensure operational continuity.


© 2024 by Enerview